

▾
Loading portfolio data…
Loading portfolio data…
A hypothetical historical model of the latest published AG composition. Holdings enter as price histories become available; early periods represent a smaller subset of today’s portfolio. Returns exclude distributions.
Choose dates or a preset. On desktop, hover for values or drag to select a date range.
How returns are shownHypothetical portfolio · Price return · Rebalanced when holdings enter
Showing Jul 01, 2024 → Oct 09, 2026 · 572 observations. Presets use calendar months; returns stay based on inception.
→
| Benchmark | Return | AG lead / lag |
|---|---|---|
| Global equities (VT) | +41.72% | +226.33 pp |
| U.S. equities (VTI) | +42.49% | +225.56 pp |
| International equities (VXUS) | +40.50% | +227.55 pp |
Lead / lag is AG return minus benchmark return, in percentage points (pp). Positive means ahead; negative means behind.
Return measures growth between the selected closes. Drawdown is the largest drop from a prior peak within this window. Chart rebasing does not change these figures. Distributions are excluded.
Jul 01, 2024 → Oct 09, 2026 · Same dates as the chart. Select a theme to explore its holdings.
| Included holdings | History begins | ||||
|---|---|---|---|---|---|
| 9.08% | +689.94% | -61.64% | 5 / 5 100% theme weight | Jul 01, 2024 | |
| 4.84% | +529.09% | -73.88% | 8 / 8 100% theme weight | Jul 01, 2024 | |
| 5.46% | +233.40% | -54.21% | 7 / 7 100% theme weight | Jul 01, 2024 | |
| 40.51% | +211.01% | -33.58% | 14 / 14 100% theme weight | Jul 01, 2024 | |
| 10.95% | +174.28% | -53.55% | 6 / 6 100% theme weight | Jul 01, 2024 | |
| 5.47% | +162.35% | -25.73% | 5 / 5 100% theme weight | Jul 01, 2024 | |
| 2.42% | +65.54% | -55.53% | 6 / 6 100% theme weight | Jul 01, 2024 | |
| 5.47% | +53.65% | -29.35% | 6 / 6 100% theme weight | Jul 01, 2024 | |
| 5.47% | +50.33% | -57.47% | 6 / 6 100% theme weight | Jul 01, 2024 | |
| 5.46% | +13.39% | -60.45% | 6 / 6 100% theme weight | Jul 01, 2024 | |
| 4.87% | +9.65% | -60.21% | 7 / 7 100% theme weight | Jul 01, 2024 |
Current snapshot weights are applied retrospectively. Holdings enter as history becomes available. Coverage shows admitted holdings and target weight at the selected end date; it does not certify price freshness. Missing endpoint prices leave returns unavailable; incomplete paths leave drawdown unavailable. Returns exclude distributions.
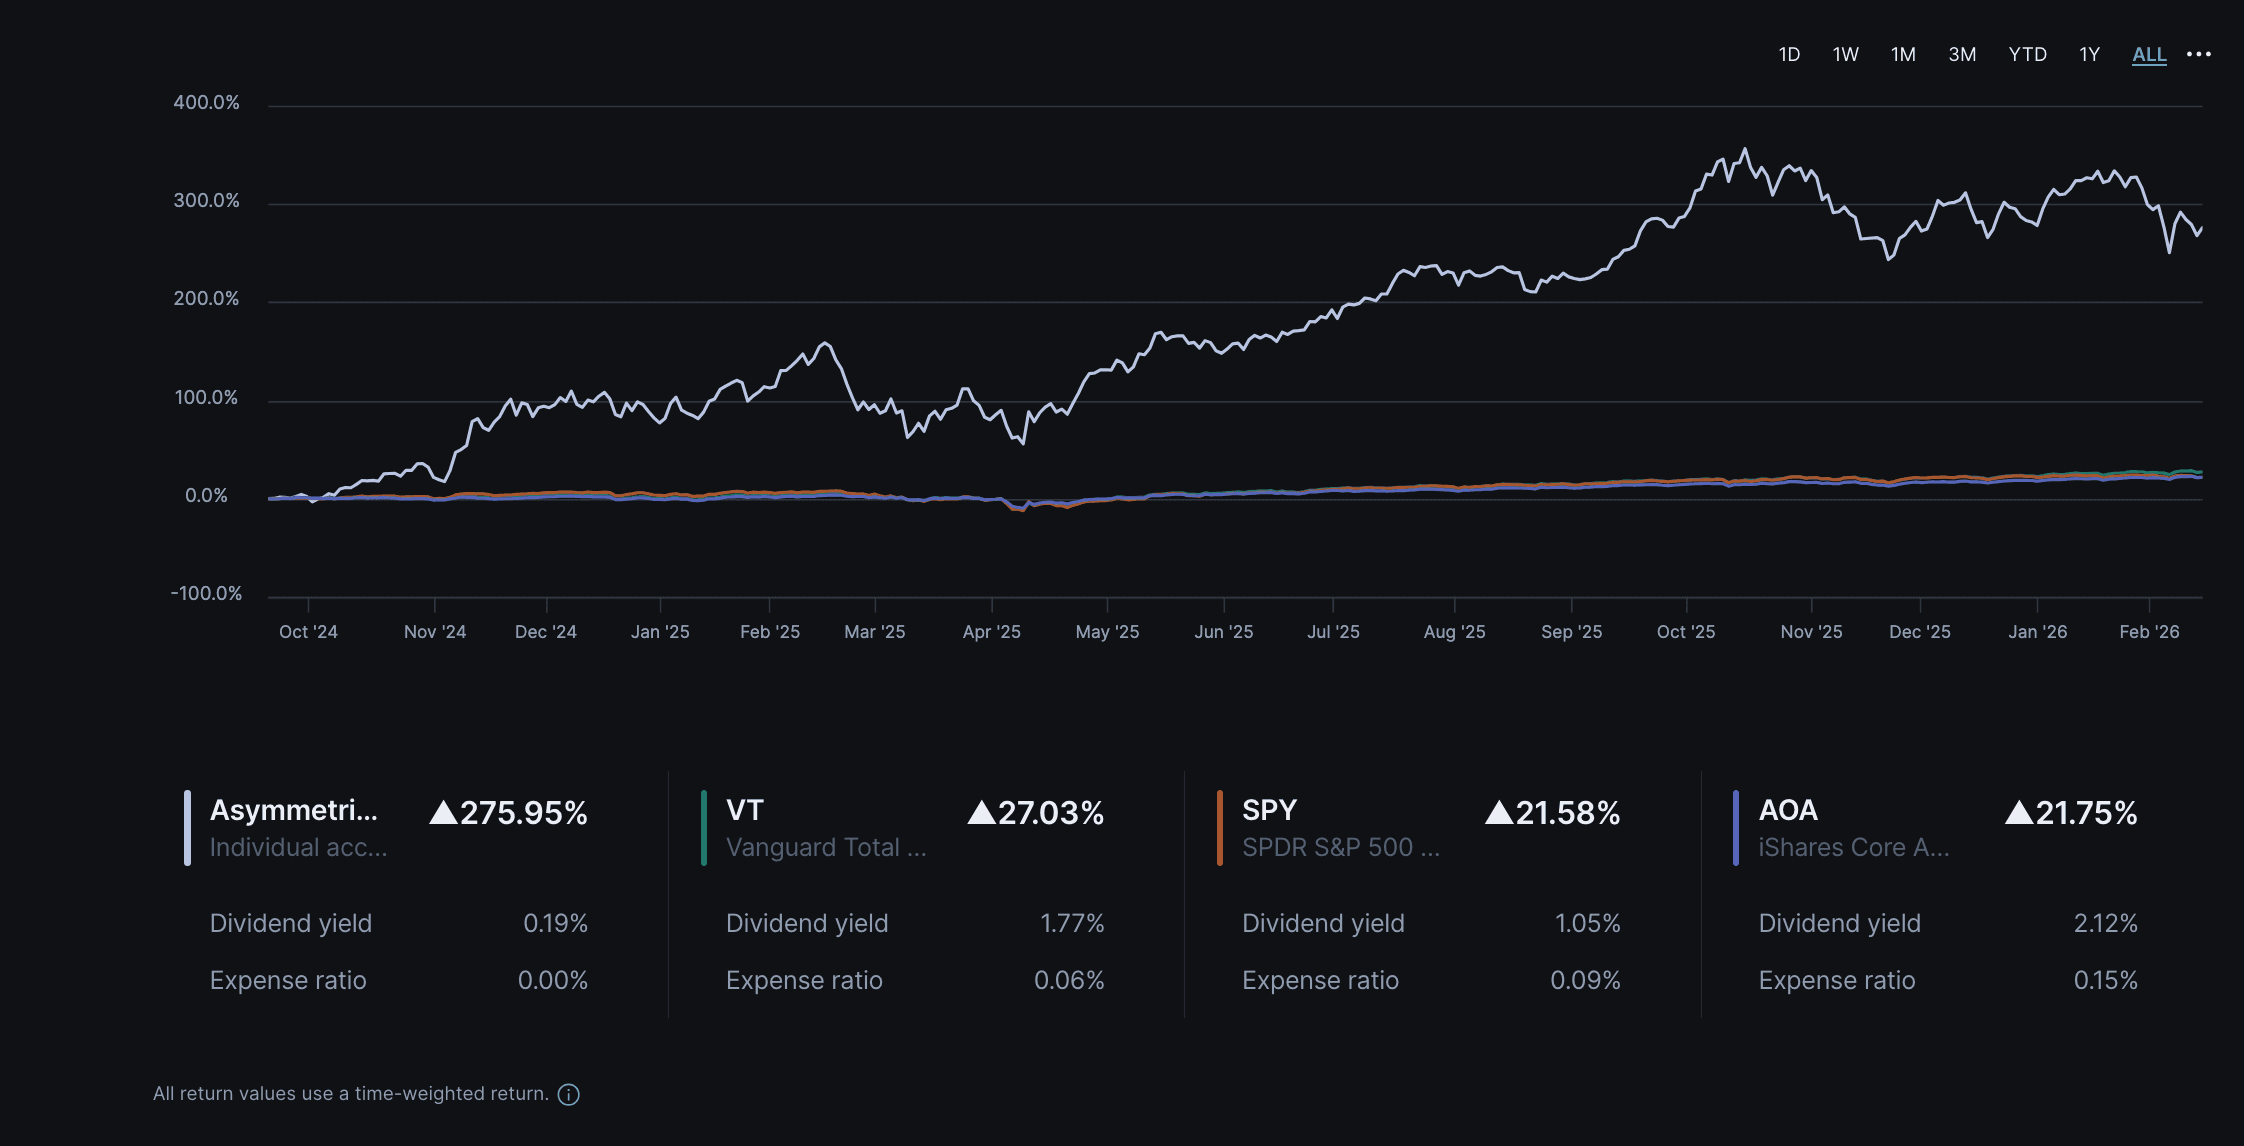
These archived charts provide separate research and implementation context. The historical model uses monthly rebalancing and adjusted-close data; the actual implementation record reflects executed account performance. Their periods and methods differ from the regularly refreshed, entry-based price-return model above. They should not be read as one continuous performance record.
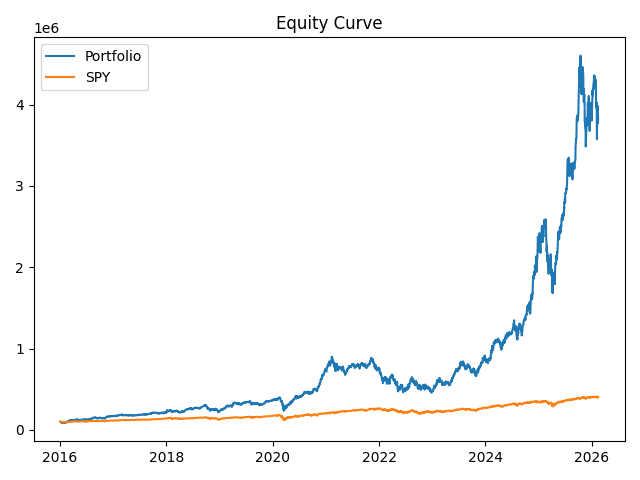
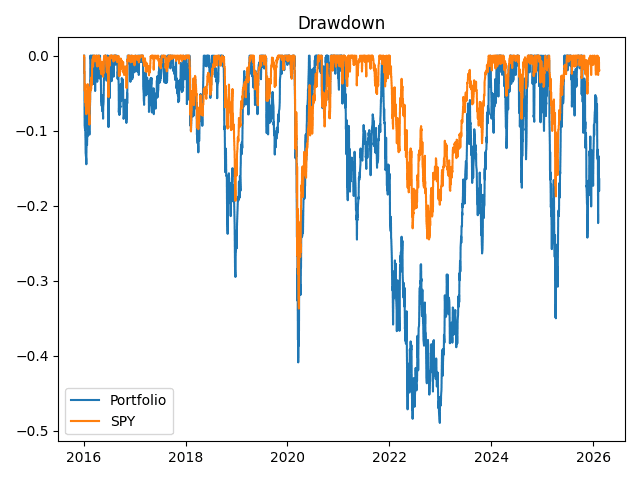
The rules-based backtest uses daily adjusted-close data, fixed target weights, and month-end rebalancing. When a holding does not yet have trading history on a rebalance date, it is excluded for that period and the remaining investable weights are re-scaled proportionally. The model also applies a simple turnover-based fee assumption, but it is not a full execution simulator and does not model taxes, liquidity constraints, bid-ask spreads, staged entries, or exact real-world cash flows.
The actual implementation record shown above serves a different purpose: it reflects actual execution, contribution timing, and realized portfolio behavior since inception. These two views are designed to complement one another rather than match period by period.