

What stands out
- Score levels and daily score changes tell different stories. The strongest searched forward correlation was inverse, rather than a simple “higher score, higher return” relationship.
- A roughly 70% direction result matched the historical-mean baseline. Other configurations improved direction accuracy or return-error measures, with meaningful tradeoffs.
- The history contains only eight nonoverlapping 20-session windows for the leading monthly candidates. We are documenting observations and continuing to collect evidence.
The question and the sample
The Macro Regime Framework organizes current conditions into inflation, liquidity, risk preference, and growth. Its composite summarizes those readings. We wanted to examine a separate question: how have those scores lined up with equity price movements before and after each reading?
This is an exploratory study of an existing framework, rather than an exercise in changing its scoring to fit returns. We retained the composite and its four pillars, tested both their levels and one-session changes, and looked across VOO, VTI, QQQ, DIA, and VTWO. These are five related equity ETF exposures, not five independent markets.
The frozen capture contains 234 calendar-day readings from February 22 through October 13, 2026, including 162 on exchange trading sessions. Prices extend through October 15. The imported history uses the same formulas throughout and records scores using inputs available at the time. Exact intraday availability is not recorded.
We examined 6,150 configurations: five ETFs, five score measures, two input forms, three return windows (1, 5, and 20 sessions), and 41 start offsets (−20 through +20). The 3,000 configurations with positive offsets received chronological regression checks. This breadth helps reveal patterns, but also creates many opportunities to find an attractive result by chance.
What an offset actually measures
An offset describes when a return window starts; the horizon describes its length. A +7 offset with a 20-session horizon measures the price change from the seventh session after the score to the twenty-seventh session after it. It does not establish that the model gives seven days of warning before a market move.
Likewise, +1 / 20 runs from the next session’s close to 20 sessions after that close. The positive start leaves a session between the score date and the start price, avoiding an assumption that the score was tradable at the same day’s close. It does not resolve every execution or publication-time question. Nonpositive starts are descriptive comparisons; some still extend into later dates when the return window is long.
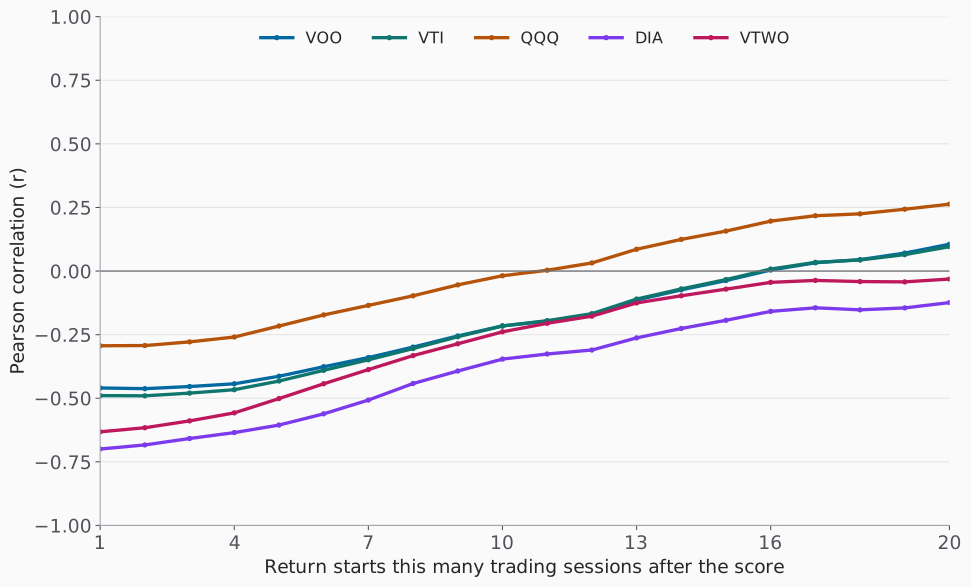
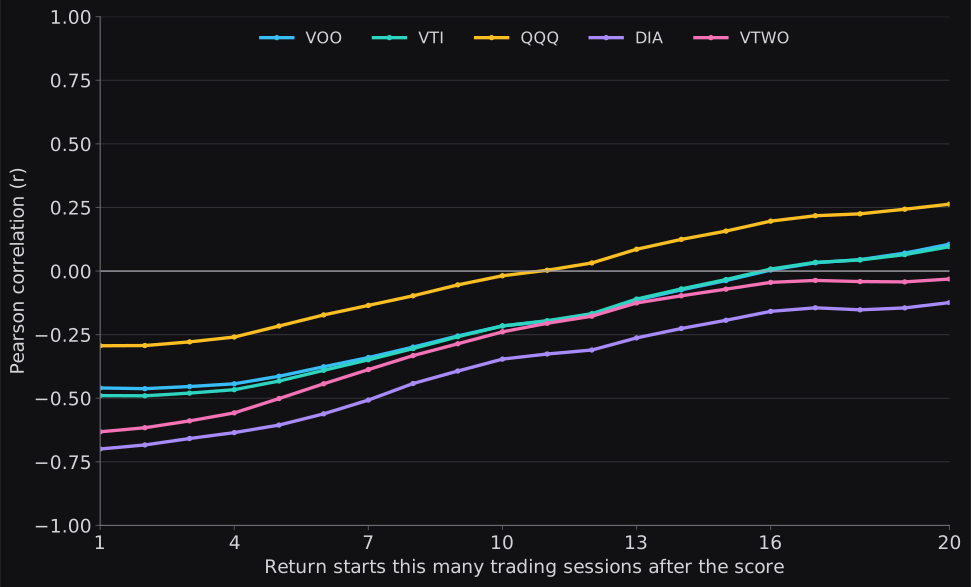
On this common cohort, the inverse associations weaken as the return starts farther from the score date. QQQ crosses above zero around +11, and VOO and VTI become positive at longer offsets; DIA remains negative through +20. The timing relationship is therefore sensitive to the market exposure and window, rather than evidence of one universal lead time.
Pearson correlation, r, ranges from −1 to +1 and describes a linear association. Its sign matters. A negative relationship here means that higher score levels tended to accompany lower subsequent returns in the specified window. It does not measure the probability of the next market move, identify causation, or imply that the score should be inverted.
Understanding the 70% observation
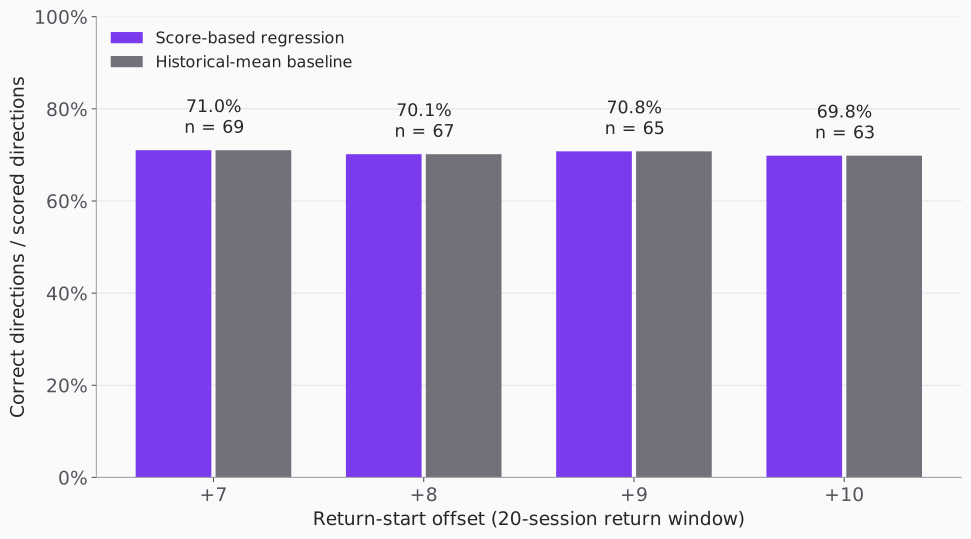
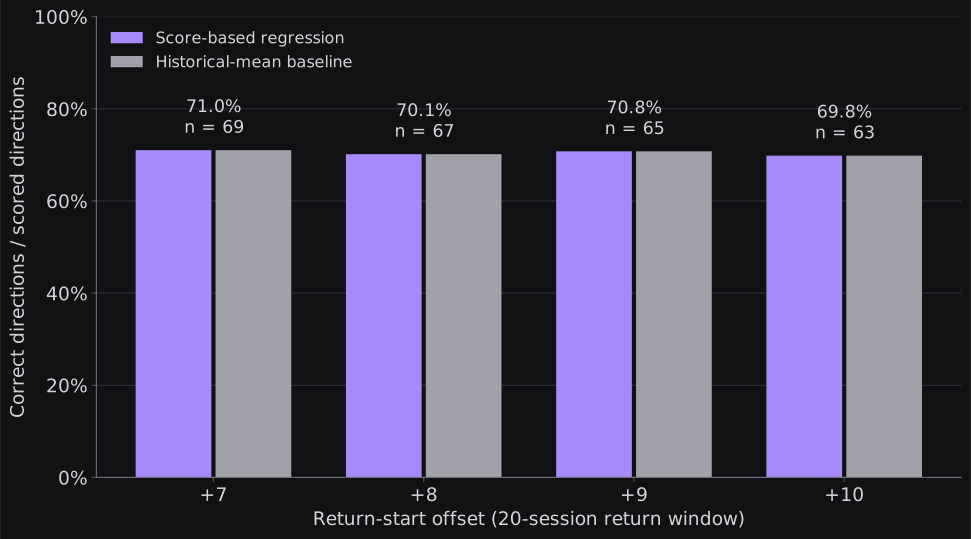
The original observation was a roughly 70% baseline accuracy around +7 to +10 sessions. We reproduced it for VOO, composite daily changes, and 20-session returns. The score-based regression and historical-mean baseline both predicted a positive return on every evaluated date.
| Start offset | Directions scored | Regression / baseline | Declines called / observed |
|---|---|---|---|
| +7 | 69 | 71.0% / 71.0% | 0 / 20 |
| +8 | 67 | 70.1% / 70.1% | 0 / 20 |
| +9 | 65 | 70.8% / 70.8% | 0 / 19 |
| +10 | 63 | 69.8% / 69.8% | 0 / 19 |
The baseline is the mean return of the same earlier, fully resolved training observations used by the regression. Its sign supplies the baseline direction. Here that mean was positive, so baseline accuracy also equals the share of positive outcomes. This is useful context: 70% can be an interesting description of the sampled market without establishing incremental direction information from the score.
Balanced accuracy averages the fraction of rising windows correctly identified and the fraction of declining windows correctly identified. These four settings each score 50% on that measure: they identify every rise and no decline. Small improvements in squared error remain possible because the estimated size of a return can improve even when the predicted direction stays positive.
The noteworthy associations
The strongest absolute forward correlation in the search was DIA, composite level, +1 / 20: r = −0.750 across 143 overlapping windows. A rank-based check also remained negative (Spearman r = −0.671). This inverse association is worth investigating, especially because its sign differs from the intuitive idea that improving conditions should simply lead to rising prices.
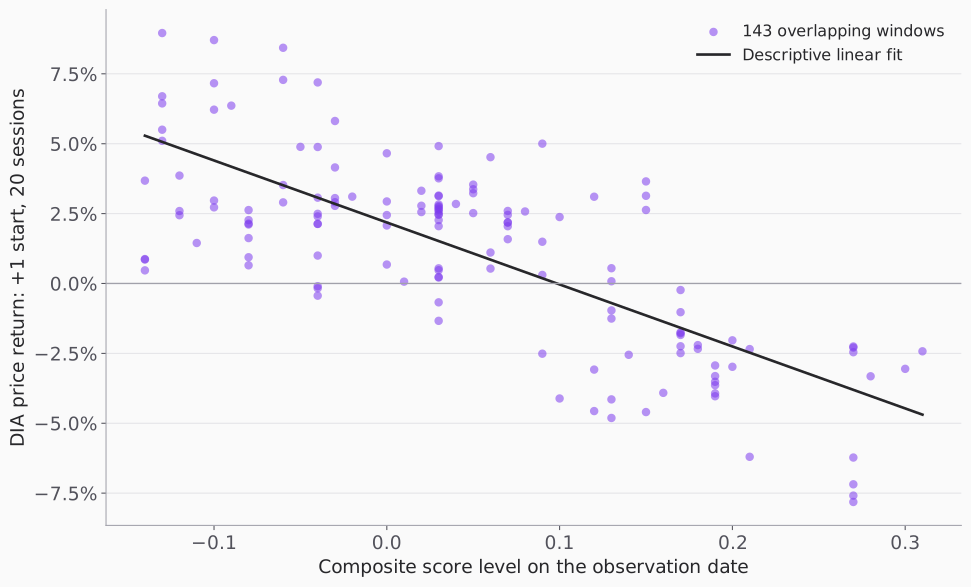
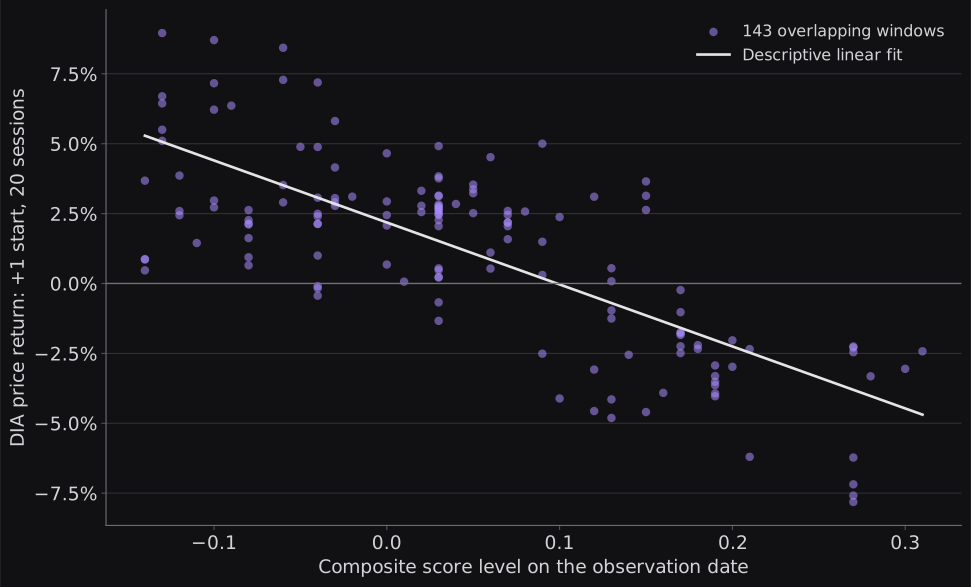
Several explanations could be investigated: score levels and changes may capture different stages of a market cycle; prices may already reflect improving conditions; or one short period may dominate the relationship. This study cannot distinguish those explanations. The appropriate conclusion is a research question, rather than a new timing rule.
| ETF · input · start / horizon | Paired r (n) | Direction: regression / baseline | Squared-error improvement |
|---|---|---|---|
| DIA · composite level · +1 / 20 | -0.750 (143) | 85.4% / 57.3% (n=82) | -7.6% |
| VTWO · composite level · +1 / 20 | -0.699 (143) | 80.5% / 46.3% (n=82) | -20.2% |
| VTWO · risk-preference level · +1 / 20 | -0.719 (143) | 65.9% / 46.3% (n=82) | 52.9% |
| VOO · composite change · +11 / 1 | 0.249 (151) | 56.1% / 49.0% (n=98) | 7.4% |
For DIA, the expanding regression gets 70 of 82 directions right (85.4%), compared with 47 of 82 (57.3%) for the baseline. Yet it has 7.6% more squared error. Its direction record and magnitude estimates therefore tell different stories. VTWO’s composite-level setting shows the same tension: 80.5% direction accuracy, but 20.2% more squared error than baseline.
The VTWO risk-preference setting has the best full-period squared-error improvement among positive-offset configurations with at least 40 forecasts: 52.9% less squared error. Its direction accuracy is 65.9%, and it identifies only 19 of 44 declining windows (43.2%). VOO daily composite changes at +11 / 1 show a smaller positive association (r = +0.249), 56.1% direction accuracy versus 49.0% baseline, and 7.4% less squared error.
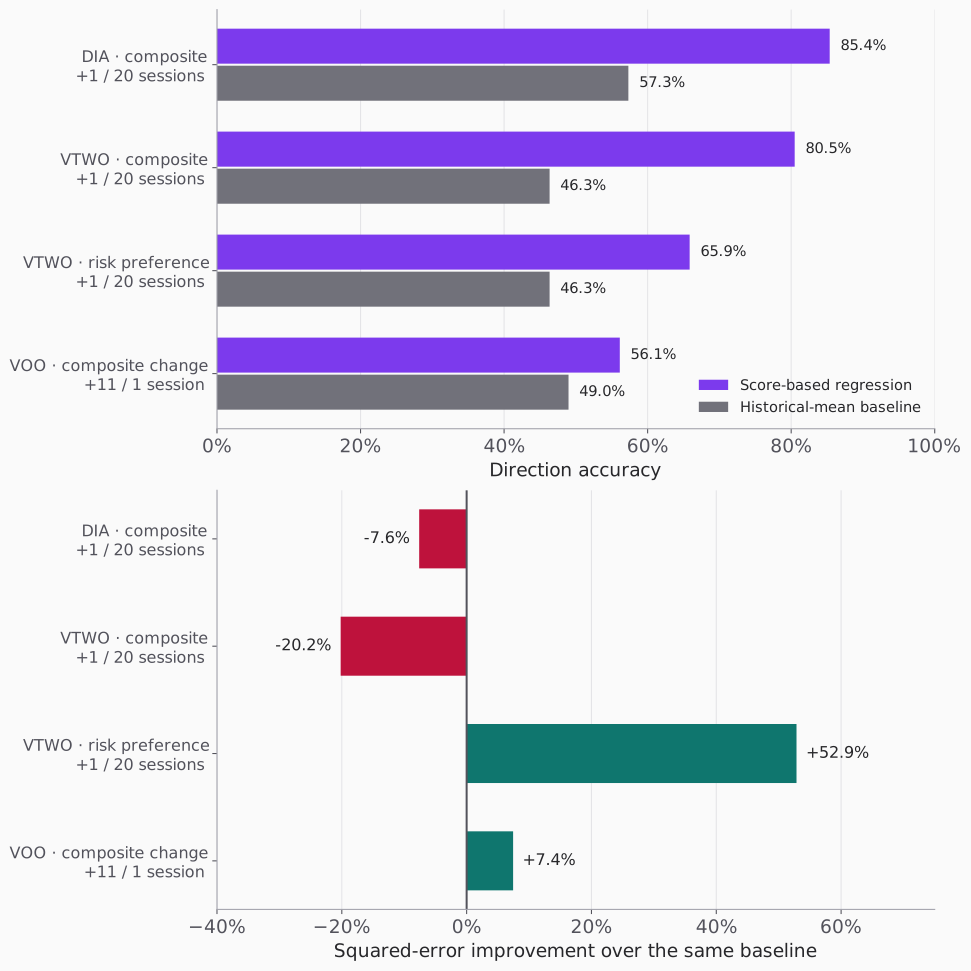
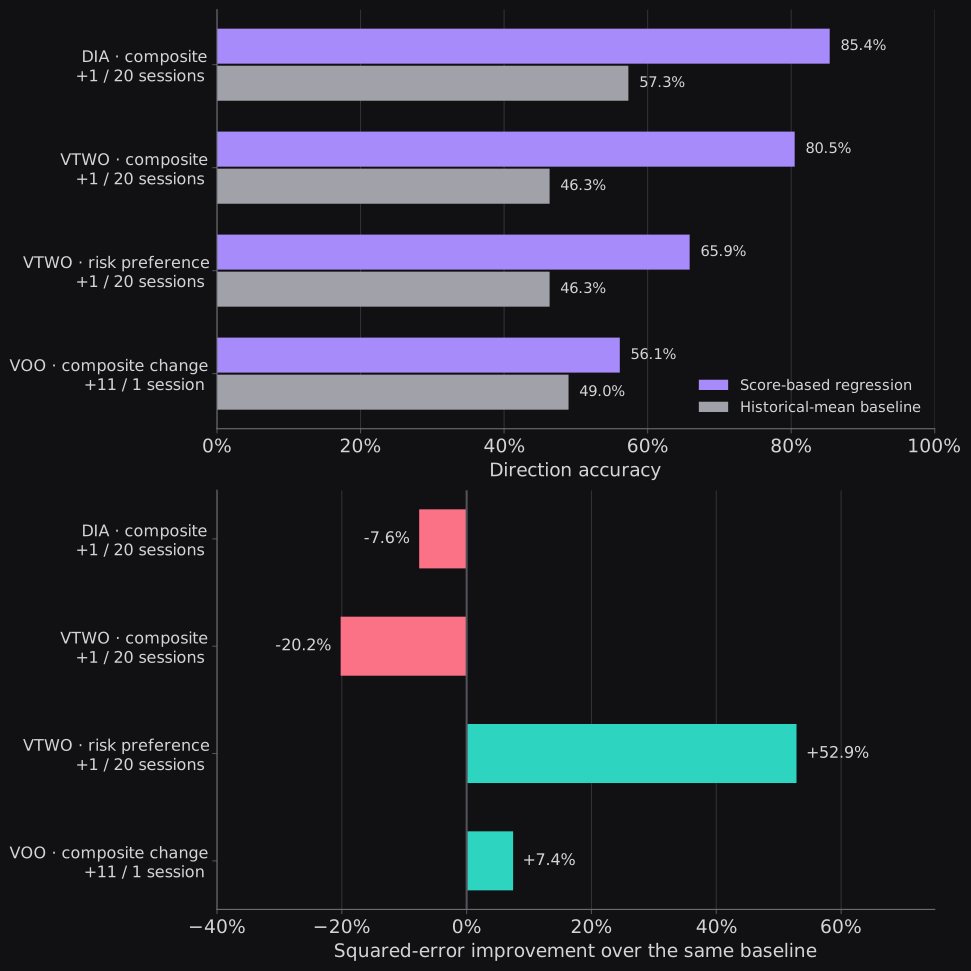
We report each setting’s full eligible history here, so offsets and horizons have different evaluation dates. The three +1 / 20 candidates have forecast score dates from May 20 through September 16; VOO +11 / 1 runs from May 8 through September 29. All outcomes end by October 15. Correlations use more observations than forecasts because chronological fitting first needs enough completed training outcomes.
A later-period check
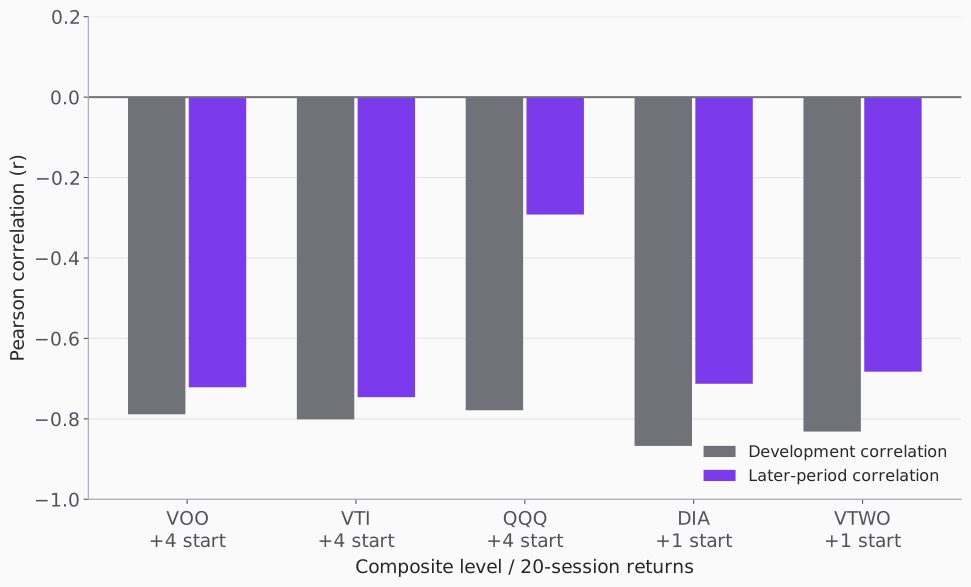
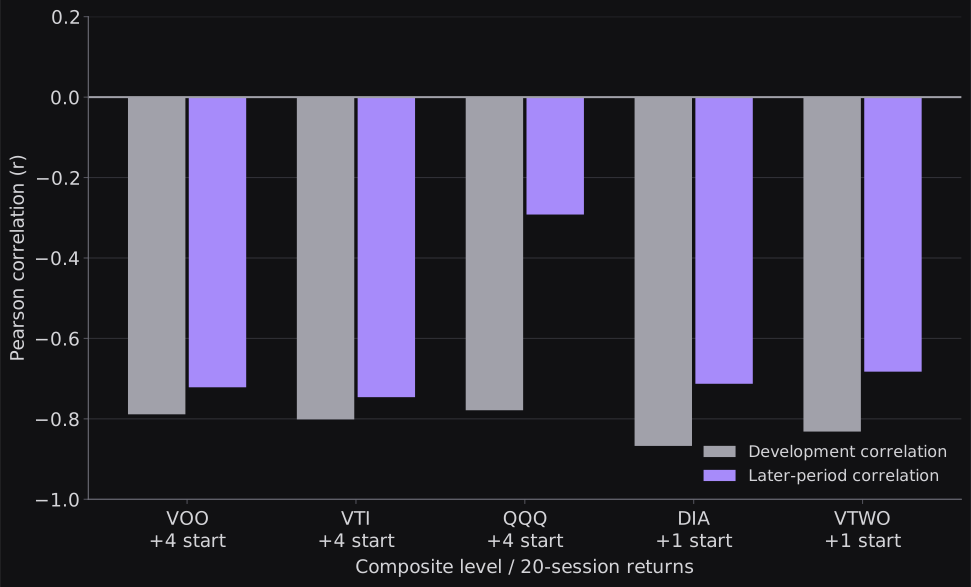
We also compared settings on a shared cohort of 123 score dates, avoiding the problem of comparing offsets over different market periods. The last 37 dates, June 29–August 19, formed a later evaluation segment. Development selection used only return windows that ended strictly before June 29. For each ETF and horizon, we selected the strongest absolute development correlation from composite-only candidates and, separately, from all five score measures.
The selected feature, input form, offset, and horizon stayed fixed during the later segment. Regression fits could expand as earlier outcomes became available, always requiring training returns to end before the new score date. This is a retrospective chronological check: the overall history had already been explored, so this segment is not genuinely untouched future evidence.
| ETF / offset | Development r | Later r | Direction: regression / baseline | Error improvement |
|---|---|---|---|---|
| VOO / +4 | -0.789 | -0.722 | 81.1% / 70.3% | 39.3% |
| VTI / +4 | -0.801 | -0.746 | 83.8% / 67.6% | 54.4% |
| QQQ / +4 | -0.779 | -0.292 | 62.2% / 62.2% | 16.8% |
| DIA / +1 | -0.867 | -0.713 | 81.1% / 56.8% | 39.9% |
| VTWO / +1 | -0.832 | -0.683 | 78.4% / 51.4% | 61.3% |
The retained inverse relationships are noteworthy, but their strength varies. QQQ weakens from r = −0.779 to −0.292, and its direction accuracy matches baseline. For DIA, later direction accuracy is 30 of 37 (81.1%) versus 21 of 37 (56.8%). Those 37 windows overlap heavily. A greedy nonoverlapping later subset contains only two windows, and the DIA regression gets neither direction right. Neither 81.1% nor 0 of 2 supplies a stable future success rate.
Broader feature selection also produced cautionary examples. For VTI’s 20-session horizon, the all-pillar development winner was inflation level at +18, with development r = +0.929. Its later r fell to +0.301, direction accuracy matched baseline at 48.6%, and squared error was 184.7% greater than baseline. The full download includes all 30 development selections, rather than only the successful-looking rows.
How much evidence do we have?
Adjacent 20-session returns share most of their underlying price changes. The three leading +1 / 20 settings have only eight nonoverlapping return windows across their full paired history. After training is required, different starting phases leave only four to five nonoverlapping forecast windows. Their direction accuracy ranges from 50% to 100% for the composite candidates and 25% to 100% for VTWO risk preference. The small counts are the central limitation.
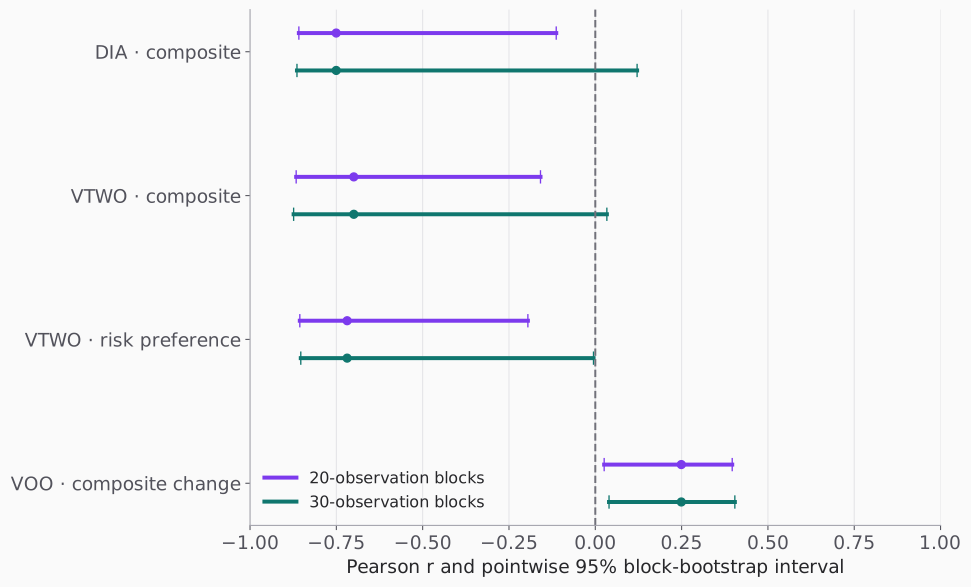
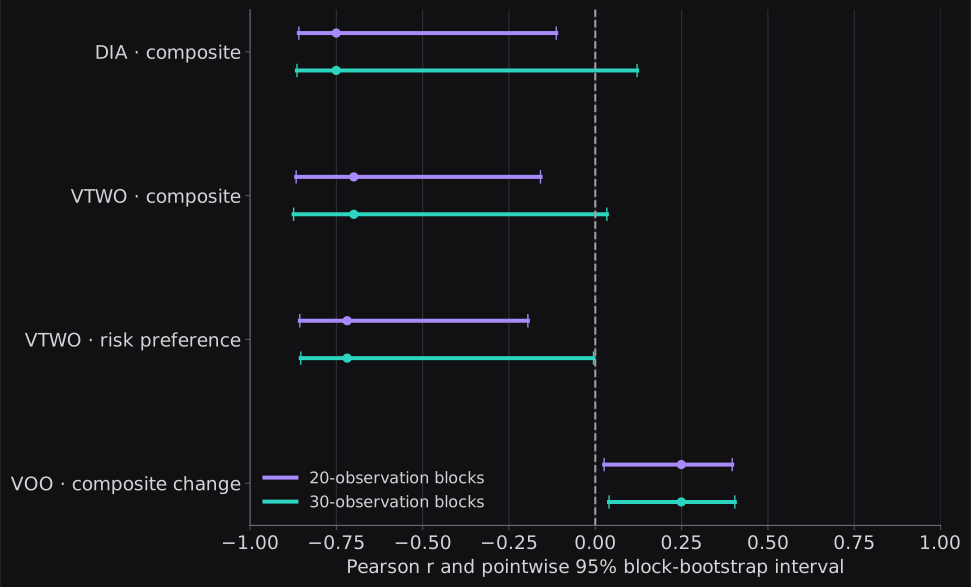
With 20-observation blocks, DIA’s interval is −0.859 to −0.113. With 30-observation blocks it widens to −0.864 to +0.121, including zero. VTWO composite shows similar sensitivity. Forty-observation blocks do not meet the study’s minimum of four block lengths of data for any of these four candidates. The sample cannot support that check yet.
A separate search-sensitivity exercise rotated the score features together across the shared 123-date cohort and repeated the full positive-offset search. In 53 of 122 alternative rotations, the all-feature search found a maximum absolute correlation at least as large as the original alignment’s 0.700. The composite-only search had zero such exceedances. These are phase-sensitivity diagnostics, not calibrated p-values: the stationarity and exchangeability assumptions needed for that interpretation have not been established. The 0.700 maximum uses the common cohort; DIA’s 0.750 uses its larger full eligible sample.
Results also change when the minimum training requirement changes, partly because it changes which dates are evaluated. For DIA, minimums of 20, 40, 60, and 120 completed pairs leave 102, 82, 62, and just 2 forecasts. The regression on dates common to those evaluations is unchanged. Choosing the most flattering minimum would confuse a different evaluation period with an improved model.
What we will observe next
The present evidence makes a good case for continued observation. It does not establish a single optimal configuration, a reliable lead time, or a direction predictor. The regime composite retains its role as a summary of current conditions. Investigating forward associations is a separate research task; these results do not change the production score, pillar weights, or portfolio allocations.
Three hypotheses merit tracking: the inverse composite-level association with DIA at +1 / 20; the VTWO risk-preference association at +1 / 20, especially its return-error behavior; and the smaller positive composite-change association with VOO at +11 / 1. They are candidates chosen from this search, rather than independently established signals.
- Record settings before new observations arrive. Fix the feature, offset, horizon, training rule, baseline, and evaluation measures. New evidence begins after those choices are recorded; an old period does not become prospective simply because it was absent from a saved file.
- Wait for outcomes to mature. Continue archiving scores, source dates, formula versions, and prices. Evaluate a +1 / 20 reading only after its complete return window exists. Preserve gaps rather than filling them to improve coverage.
- Report more than direction accuracy. Track baseline performance, rising- and declining-window recall, balanced accuracy, and return errors. Retain failed observations and all nonoverlapping starting phases.
- Build evidence across conditions. Review successive periods with enough independent windows, including different volatility and market environments. Keep model changes separate from the record being evaluated.
That is the next stage of the work, not a completed prospective test. The value of this first study is a clearer set of questions and a transparent starting record against which later evidence can be compared.
Methods, data and references
Construction and evaluation
- Trading calendar: match score dates to actual NYSE sessions. Daily changes require a score on the previous trading session. Do not carry missing scores or compress missing price sessions.
- Returns: close-to-close price changes for the specified ETF and exact session window. All prices within that window must be usable. Cash distributions are excluded; these are not total returns or direct index returns. No strategy profits, costs, taxes, or execution assumptions were tested.
- Regression: one score input, a linear slope, and an intercept, fitted to an expanding set of earlier observations. At least 40 training pairs are required in the main search; their score dates and return-end dates must precede the evaluated score date.
- Baseline: the mean return of the identical resolved training pairs. Direction accuracy uses nonzero actual and predicted returns; baseline direction uses the same scored rows where its prediction is nonzero. Downloaded forecasts retain every actual and prediction.
- Error improvement: 1 − (sum of squared regression errors / sum of squared baseline errors). A positive value means less squared error. It is neither a reduction in root-mean-square error nor a probability of success.
- Selection: strongest absolute development Pearson correlation, requiring at least 40 development pairs; separate composite-only and all-pillar searches for each ETF/horizon. Later return labels are excluded from development selection. Settings can still benefit from prior human exploration of the full sample.
- Dependence: nonoverlapping windows share no return legs but may share an endpoint. Resampling uses contiguous score-date blocks; the study requires at least four block lengths of observations and adequate valid resamples. Intervals are pointwise, with no multiple-search correction.
- Verification: the faster search fit was checked against the website’s raw-pair research implementation on 158 configurations, including dates, predictions, training counts, and error measures. All four shortlisted forecast series were additionally reproduced with that implementation.
Frozen study downloads
This article is a dated record. Its figures do not silently change when the live dashboard refreshes. The saved input capture is October 16, 2026, at 19:24:55 EDT. Score history ends October 13 and price history ends October 15. The imported group’s legacy “version unknown” identifier is retained in the raw files; the owner has confirmed consistent historical formulas. That identifier does not imply a formula change within this sample.
- Study results and chart data (JSON) — shortlisted pairs, forecasts, bootstrap checks, phase results, offset curves, and all chronological selections.
- All 6,150 configurations (CSV) — includes descriptive nonpositive offsets and every positive-offset result.
- All 345 shortlisted forecasts (CSV) — predictions, actual returns, baseline values, and the last resolved training outcome.
- Frozen input capture (JSON) — the recorded scores and registered price histories used in this study.
Input verification fingerprint
SHA-256: ce5fb65831a832c44b75d359b0de1071e9bcab64cdea9876352abcdfd69c4bce
Methodology references and related context
Time-ordered evaluation follows the principle that training data must precede the outcome being evaluated; see Hyndman and Athanasopoulos, Forecasting: Principles and Practice, time series cross-validation. The reason for examining serial dependence is described in the NIST Engineering Statistics Handbook, Autocorrelation. Those references support the methodology discussion, rather than the particular market findings reported here.
See the Sources page for the site’s data preparation and validation process, and the Macro Regime Framework for current readings. This research is educational and does not establish a market-timing strategy or a future success probability.